Classification and Evolution
Classification and taxonomy
To make it easier for scientists to identify and study living organisms, each organism is organised into different groups based on their similarities and differences. The grouping of organisms according to their characteristics is called taxonomy. There are eight different taxonomic groups used to classify organisms. The groups are organised in a hierarchy from largest to smallest. The first group, domain, is the most broad category whereas the last group, species, is the most specific category. These groups do not overlap with one another, so an organism which is placed in the kingdom ‘animals’ will not share the same categories as an organism which belongs to the plant kingdom.
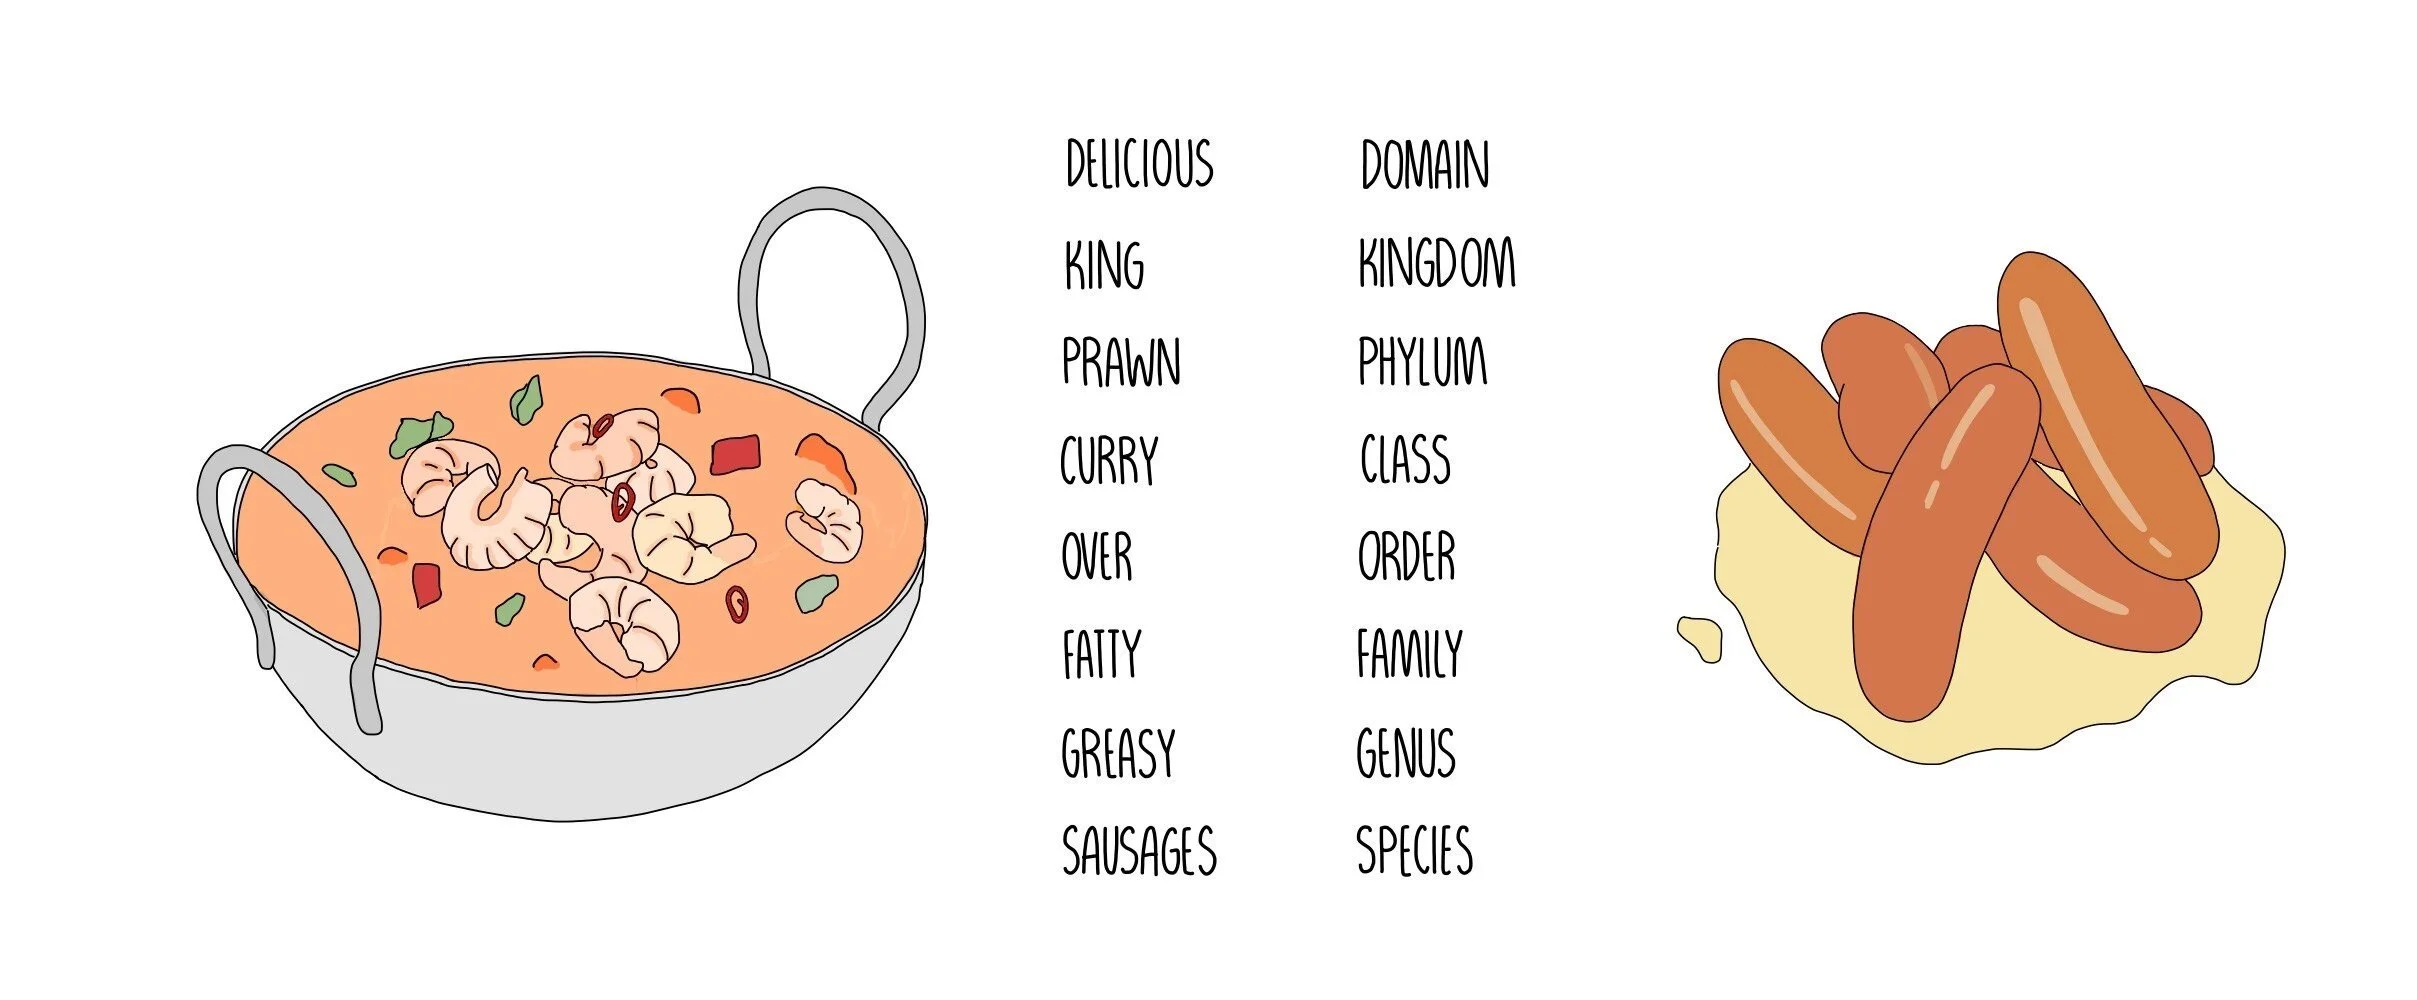
It’s useful to use a mnemonic to help you remember the order of the taxonomic groups. The classic one is ‘Dear King Phillip Came Over For Good Soup’ but my favourite is ‘Delicious King Prawn Curry Over Fatty Greasy Sausages’.
The five kingdoms
All living organisms are grouped into one of five kingdoms:
Animals – eukaryotic multicellular organisms, no cell walls, store carbohydrates as glycogen, cannot photosynthesise (heterotrophic)
Plants – eukaryotic multicellular organisms, cell walls made of cellulose, store carbohydrates as starch, obtain organic molecules by photosynthesis (autotrophic)
Fungi – eukaryotic organisms, can be unicellular (e.g. yeast) or multicellular (e.g. mushrooms), cell walls made of chitin, store carbohydrates as glycogen, obtain food by saprotrophic nutrition
Protoctists – eukaryotic organisms, usually unicellular, some protoctists have a cell wall, some have chloroplasts
Bacteria – prokaryotic unicellular organisms, no nucleus, very small
Binomial system
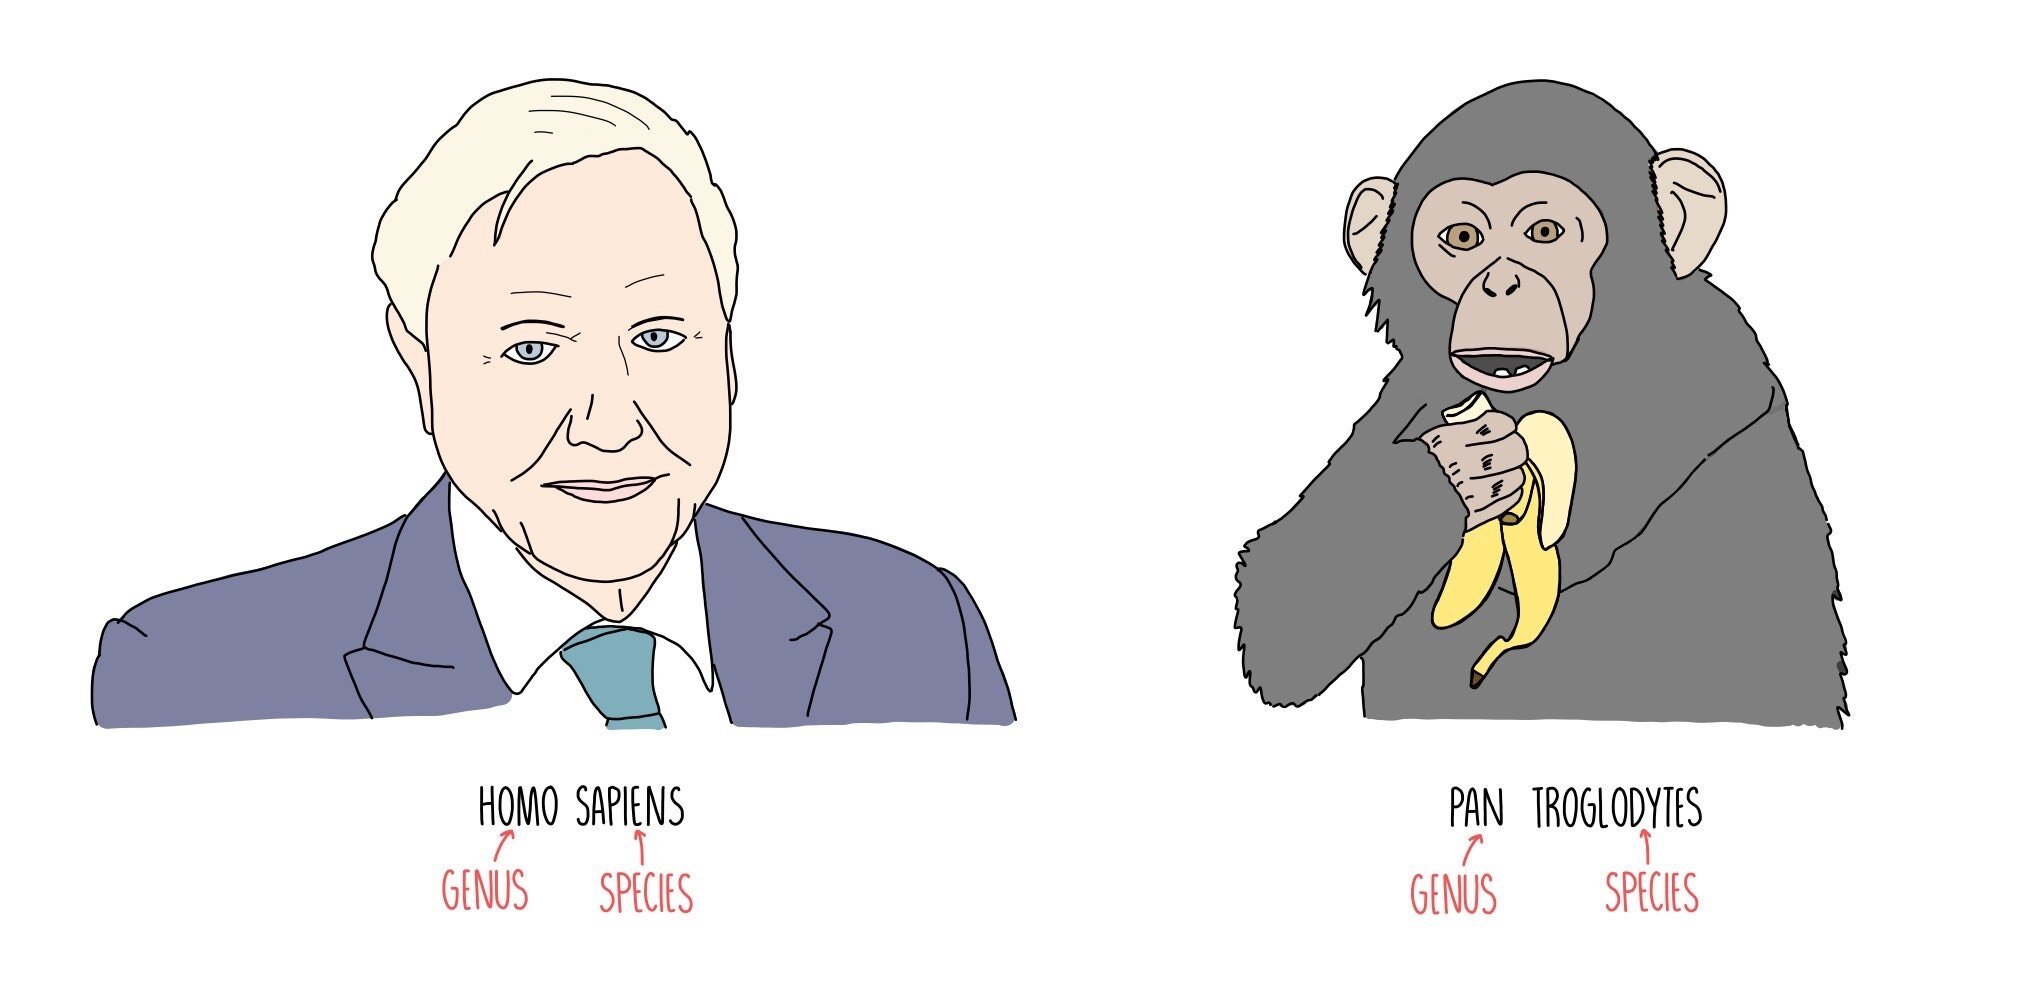
In the past, organisms were referred to by local and colloquial names and there were often hundreds of different names used to refer to the same organism. To make things more straightforward, scientists now use the binomial system for naming organisms. This two name system uses first the genus name and then the species name to refer to each organism. The scientific name for human beings is Homo Sapiens since ‘homo’ is the genus name and ‘sapiens’ is the name of our species. Likewise, the scientific name for the chimpanzee is Pan Troglodytes, which makes ‘pan’ the name of the genus and ‘troglodytes’ the name of the species.
Phylogeny
Scientists often use data from molecular phylogeny studies to decide which organisms to place into which categories. Molecular phylogeny is the study of molecules (such as DNA, RNA or amino acids) within an organism. Scientists will first choose a gene which is present in the two organisms that they want to compare and then line up the DNA base sequence or amino acid sequence. By looking at how similar these sequences are, the scientists can determine how closely related the two organisms are. The more differences in the nucleic acid or amino acid sequence, the more distantly related the two organisms and the further back in time they shared a common ancestor.
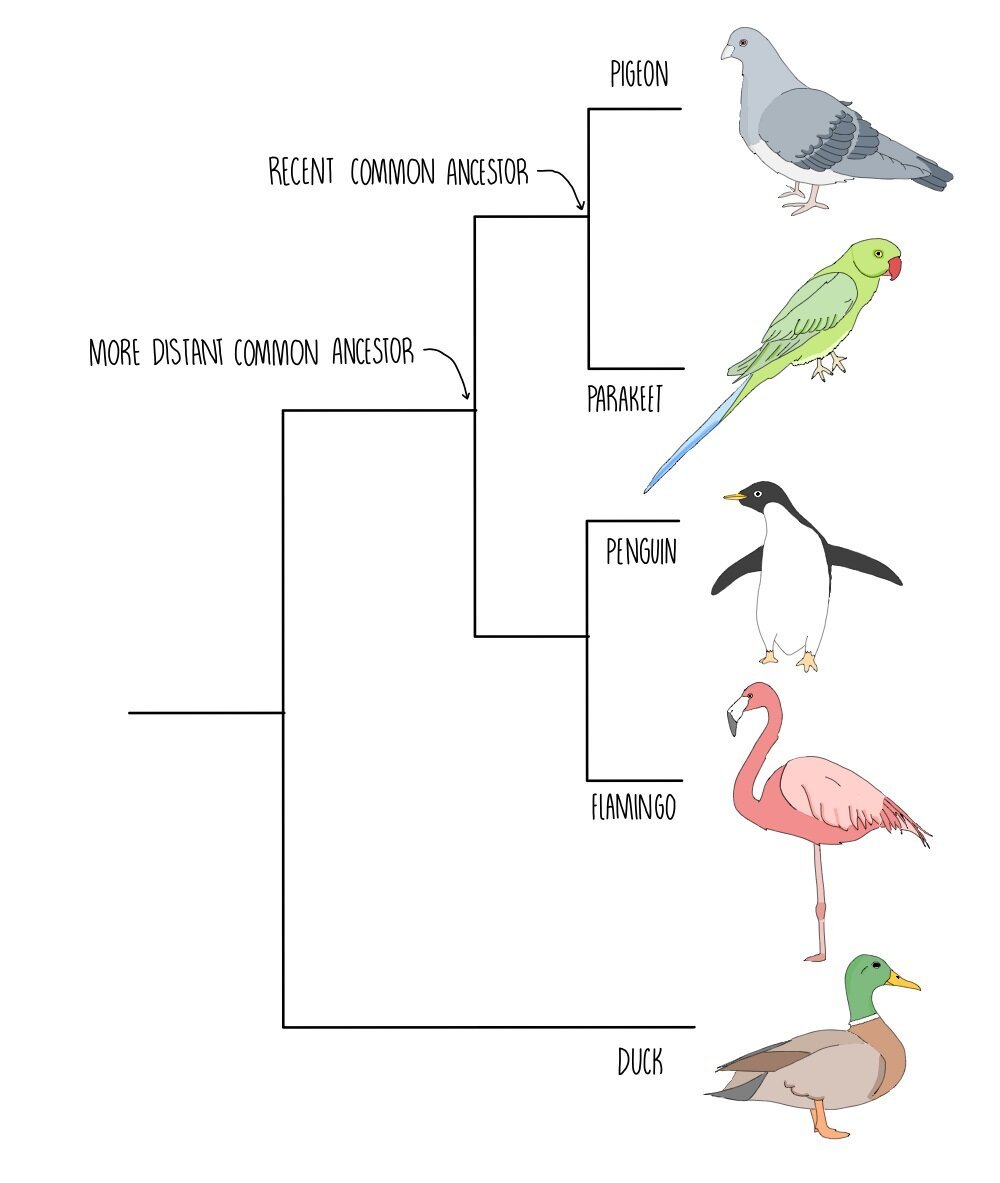
This can be shown on a phylogenetic tree like the one pictured here. The first branch point represents a common ancestor of all the bird species, which is now extinct. The tree shows that ducks were the first group to diverge and become a separate species. Closely related species diverged away from each other more recently. For example, pigeons are more closely related to parakeets than penguins as they share a more recent common ancestor. You would therefore expect pigeons to share more DNA bases in common with parakeets than penguins.
As well as using molecular evidence, such as DNA and amino acid sequences, scientists may use other evidence for classification:
Embryological evidence – similarities in embryo development
Behavioural evidence – similarities in behaviour
Anatomical evidence – similarities in physical structural features
When scientists first began classifying organisms, they relied solely on observable features. But these can be misleading as two distantly related organisms can sometimes end up looking quite similar. Scientists now use a combination of embryological, behavioural, anatomical and molecular evidence for more accurate classification, thanks to technological developments such as DNA sequencing.
If the evidence reveals the discovery of a new species, the data will be shared and evaluated by other scientists in scientific journals, conferences and peer review. Other scientists will repeat the experiment to confirm that they also get the same results. If the scientific community agrees with the findings, then the organism will be officially classified into particular taxonomic groups.
Three domain system
Based on molecular evidence, scientists realised that the five domains of live can be grouped into even broader categories. Within the bacterial kingdom, some organisms displayed differences in the enzyme RNA polymerase and their histone proteins. They also exhibited differences in their cell membranes and the composition of flagella. Bacteria were then separated into two domains – bacteria and archaea. The third domain, eukarya, consists of the four other kingdoms (animals, plants, protoctists and fungi). Archaea are more closely related to eukarya than bacteria. The development of the three domain system is an example of how scientific knowledge is always changing.
Variation
Individuals within a population show a range of phenotypes such as differences in height and hair colour. This is known as variation and may be caused by:
Genetic causes – the alleles they inherited e.g. blood type is determined by genotype
Environmental causes – conditions which have developed due to interaction with environmental factors such as sunlight or diet. Tattoos and piercings are good examples of phenotypes affected only by the environment.
A combination of genes and the environment. For example, how tall you could grow is determined by your genes but your diet will determine how tall you actually grow.
Variation can be classed as intraspecific or interspecific:
Intraspecific variation – variation within a species
·Interspecific variation – variation between different species
Continuous and discontinuous variation
Characteristics which are controlled by the expression of a single gene are said to be monogenic. These kinds of characteristics typically give rise to discontinuous variation in the phenotype that is expressed - i.e. the phenotypes can be grouped into distinct categories. An example of a characteristic controlled by a single gene is blood type.
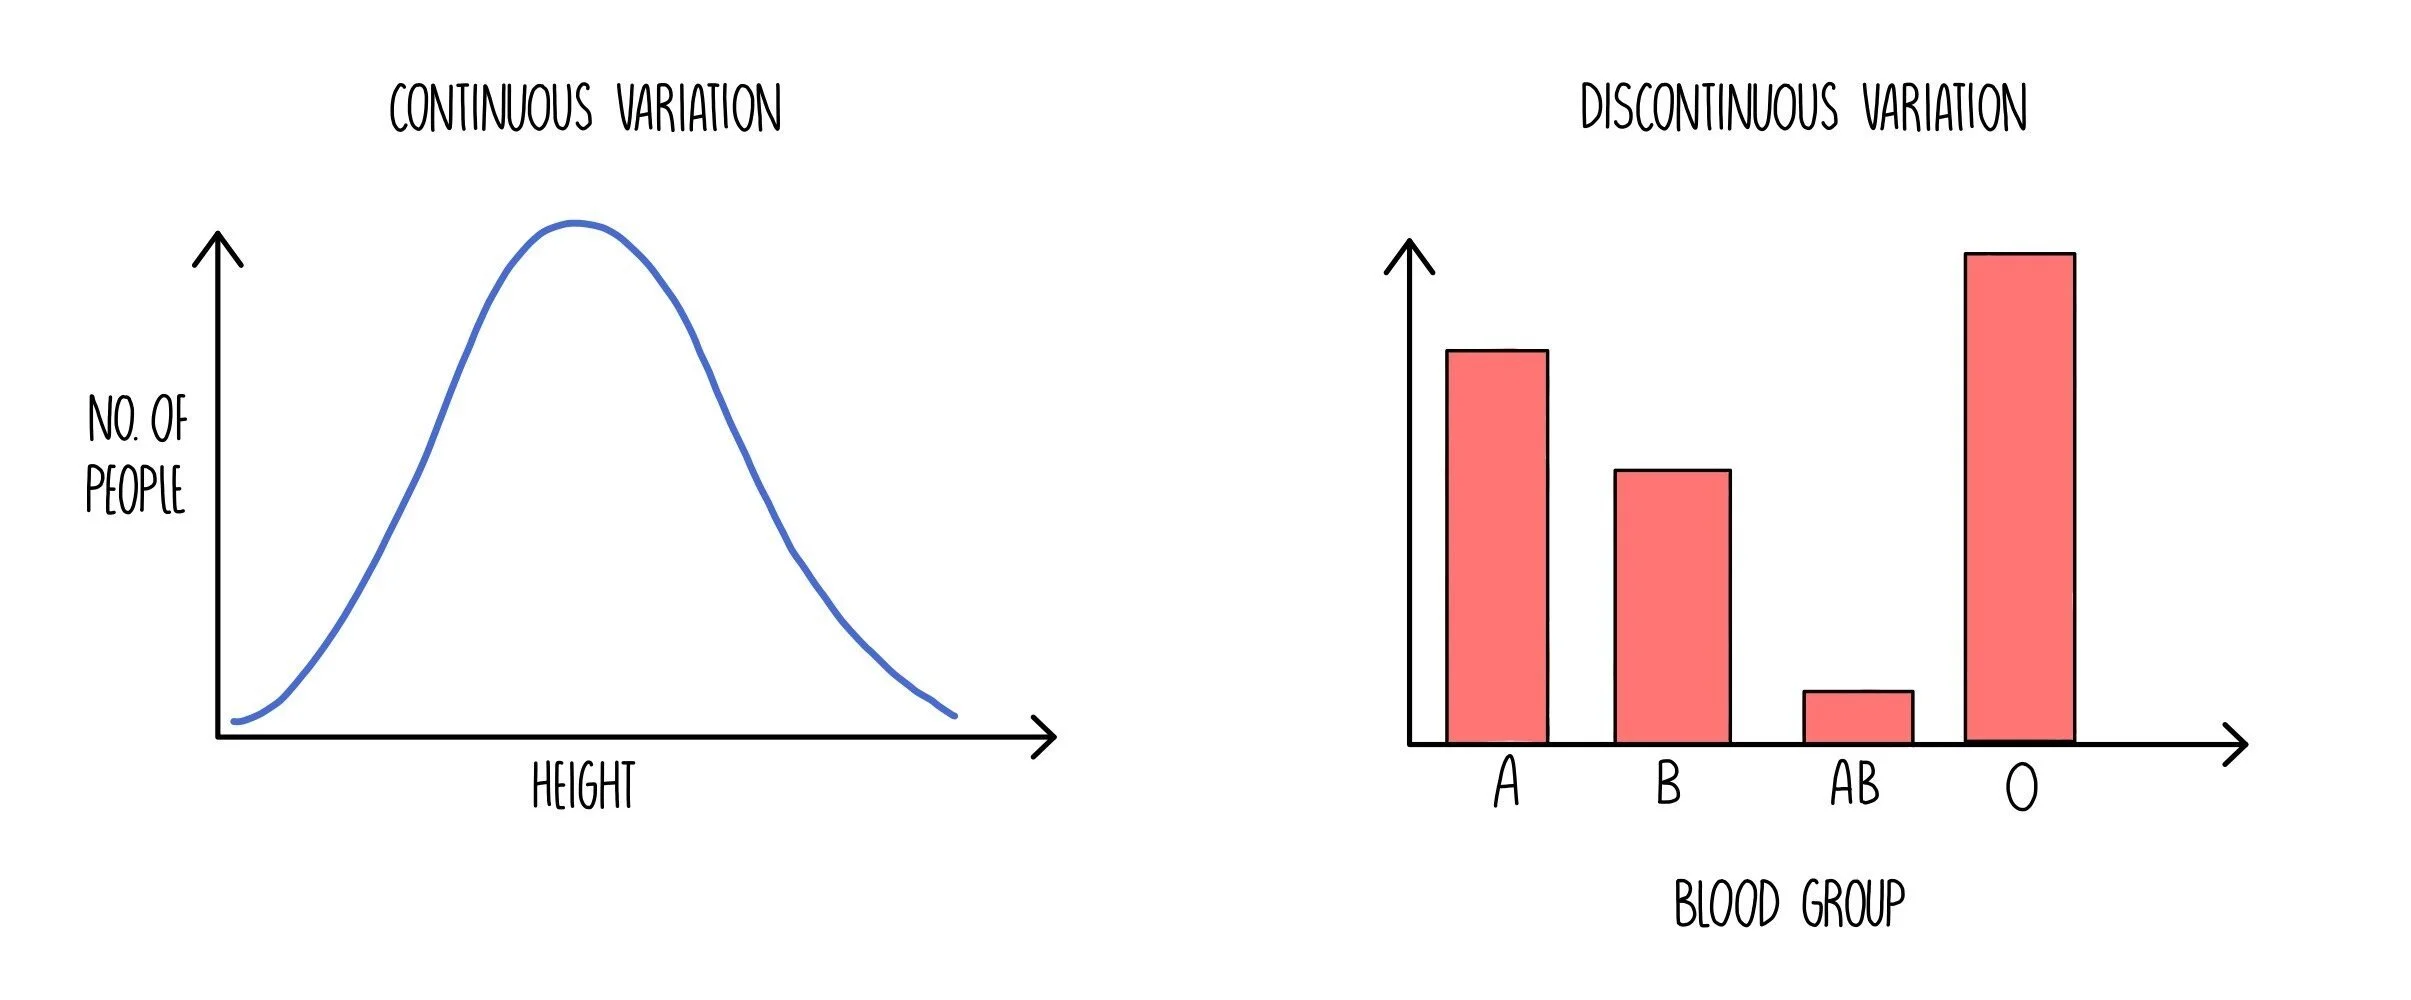
However, the majority of characteristics are controlled by many genes at different loci - they are polygenic. Polygenic characteristics show continuous variation which is when the individuals in a population vary within a range. Examples of characteristics which show polygenic inheritance are height, weight and skin colour.
Investigating variation
High phenotypic variation is a result of high genetic diversity – the more alleles in the gene pool, the greater the number of possible characteristics. Variation may also occur due to differences in the environment. Most variation is caused by a combination of both genes and the environment. For example, you can possess alleles for growing tall but malnutrition will limit your actual height.
To investigate variation, you take a sample of the population and use it as a model of the whole population. Studying the entire population would be too time-consuming and labour-intensive. It’s important that your sample is random to ensure unbiased results. You can select a random sample by dividing the habitat into a grid and using a random number generator to select coordinates. To determine whether there is a significant difference between your results (the differences aren’t just due to chance), you have to perform a statistical test.
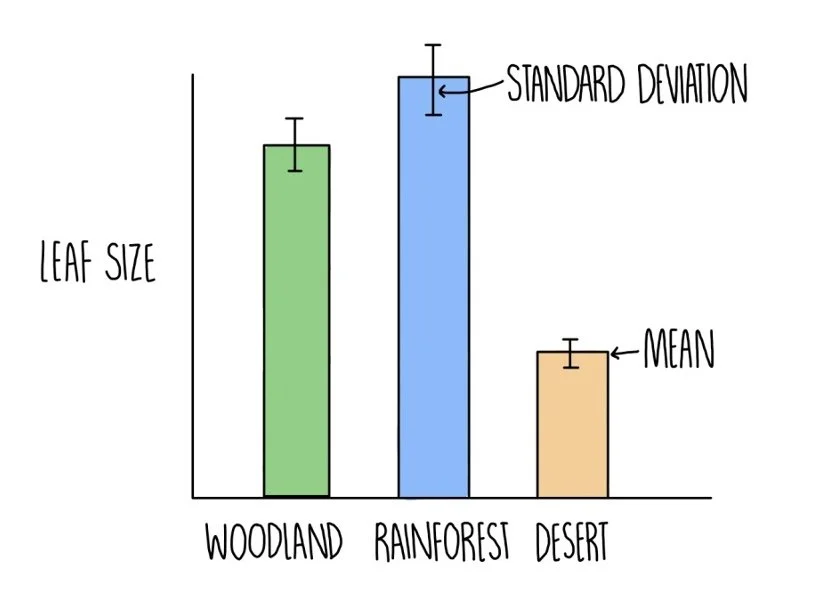
You can then plot the variation in phenotypes on a graph. You may wish to add error bars to represent standard deviation. Standard deviation is a measure of the spread of values about the mean. Error bars extend one standard deviation above and one standard deviation below the mean, so the total length of the error bar is twice the standard deviation. The larger the error bar, the greater the amount of variation in the data.
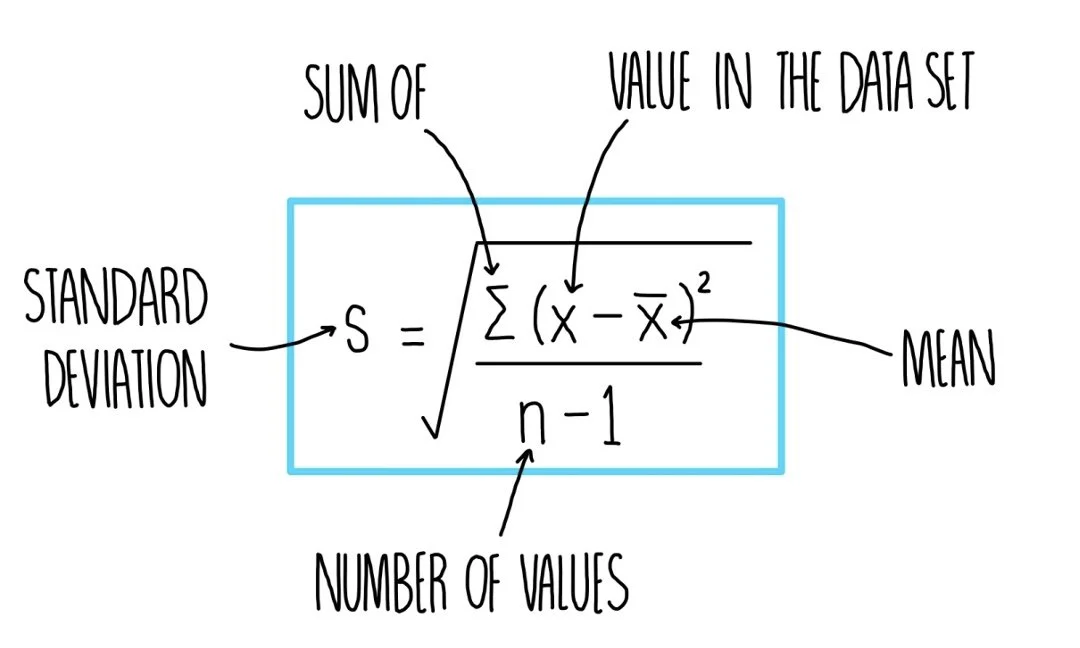
You can calculate standard deviation using the formula:
Worked example: calculating standard deviation
Q: Calculate the standard deviation in butterfly wingspan in the following population.

First, calculate the mean wingspan of the population. (47 + 50 + 45 + 49) / 4 = 47.75
Subtract each value from the mean then square it.
A = 0.5625
B = 5.0625
C = 7.5625
D = 1.5626
Add all of these values together: 0.5625 + 5.0625 + 7.5625 + 1.5626 = 14.75
Divide this by the number of values minus 1 (4 -1 = 3). Then square root it to work out standard deviation.
14.75 / 3 = 4.916
Square root (4.916) = 2.22 (to 3 sf)
Types of adaptation
Living organisms display features (adaptations) which make them suited to their niche and more likely to survive. These adaptations can be behavioural, physiological or anatomical.
Behavioural adaptations are the way that an organism acts which increase its chances of survival. For example, fish often swim in groups called schools for protection and birds migrate south during the winter to find food.
Physiological adaptations are processes which occur within the body of an organism which increase its chances of survival. For example, sloths have a low metabolism which means they can survive on food which contains a low number of calories. Plants such as the deadly nightshade produce a poison which is a defence against being eaten by animals.
Anatomical adaptations are structural features of an organism which increase its chances of survival. For example, polar bears are camouflaged against the snow and cacti have spines to prevent being eaten by animals.
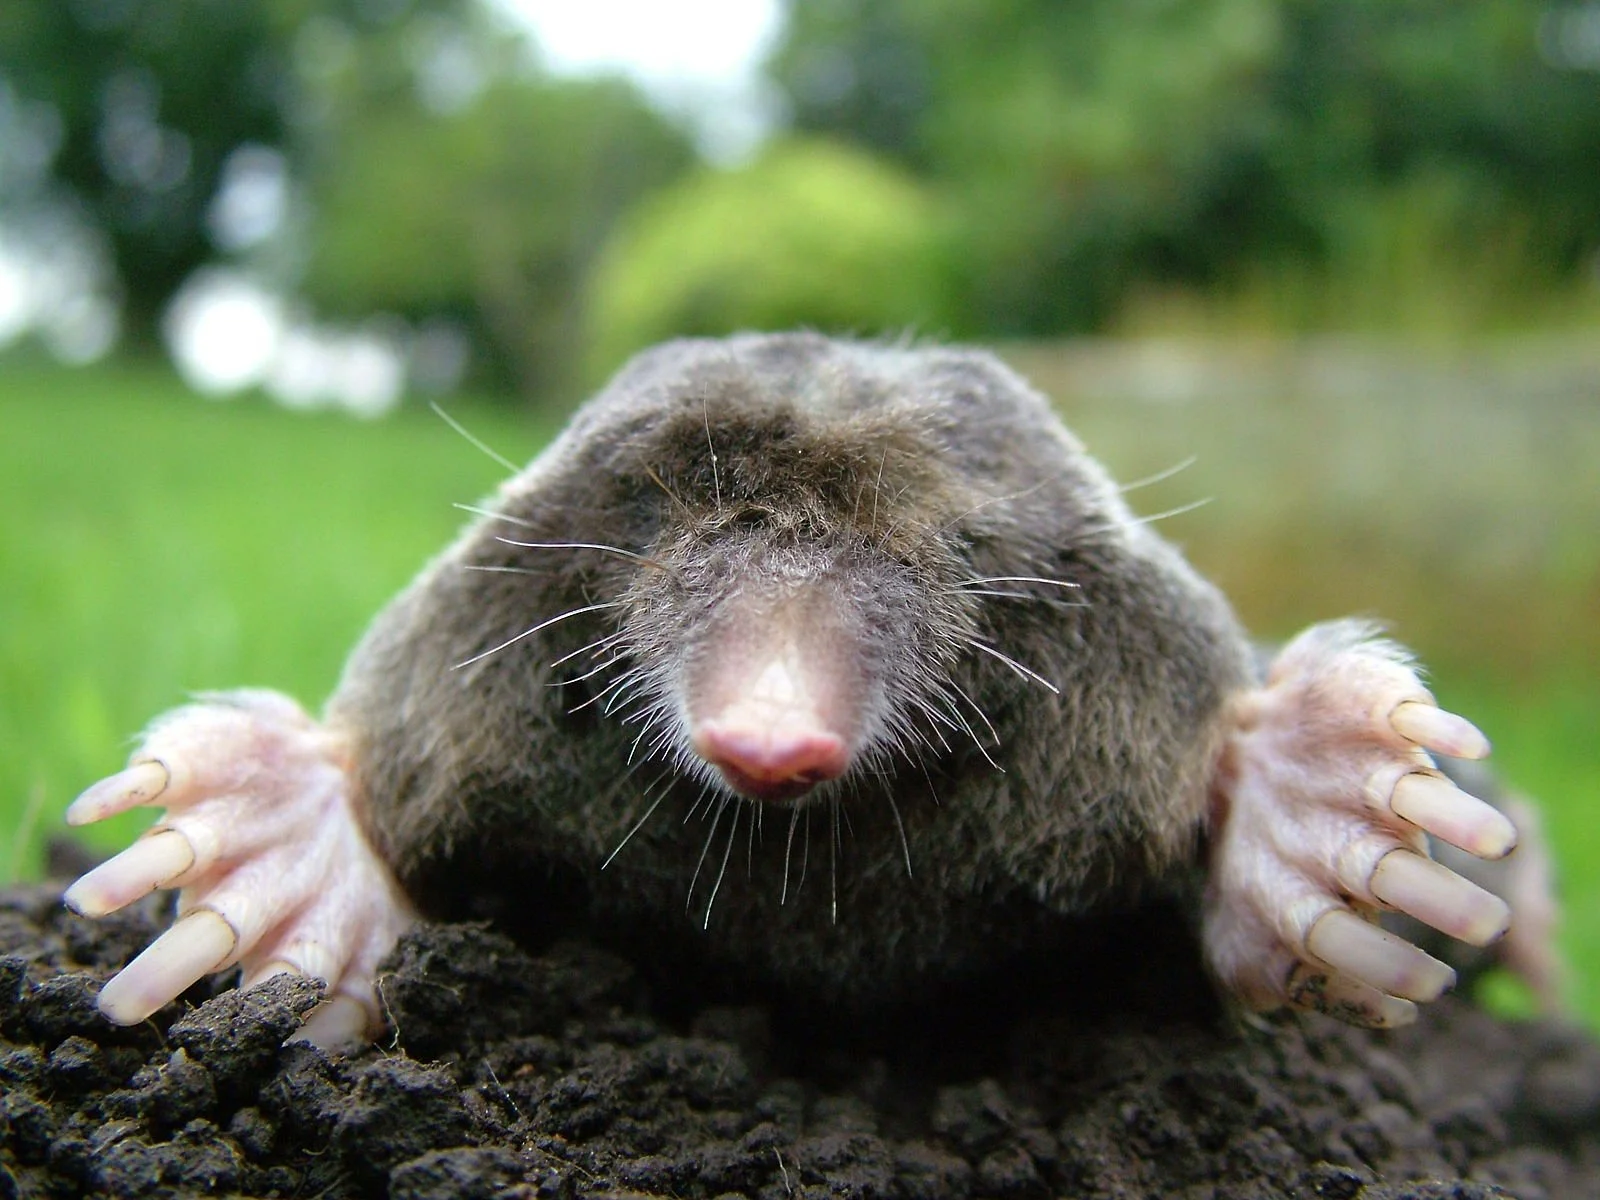
Placental mole. Credit: Michael David Hill (Wikipedia)
Convergent evolution
Sometimes, organisms in different taxonomic groups can develop similar characteristics because they have evolved in similar environments. They can end up looking very alike, despite being evolutionarily unrelated to each other.
This is the case for marsupial moles and placental moles. Marsupials are organisms that are born early and develop in the mother’s pouch (e.g. kangaroos). Placental mammals are organisms that are develop within a placenta and are born at a later stage (e.g. humans). Marsupial moles and placental moles are distantly related and evolved separately on different continents. However, they evolved to live in similar environments so they have evolved similar anatomic adaptations. Both animals live in underground tunnels and burrow for food, which means both have evolved powerful front paws and claws for digging. Their heads are cone-shapes to make them better at pushing through the soil.
Natural selection
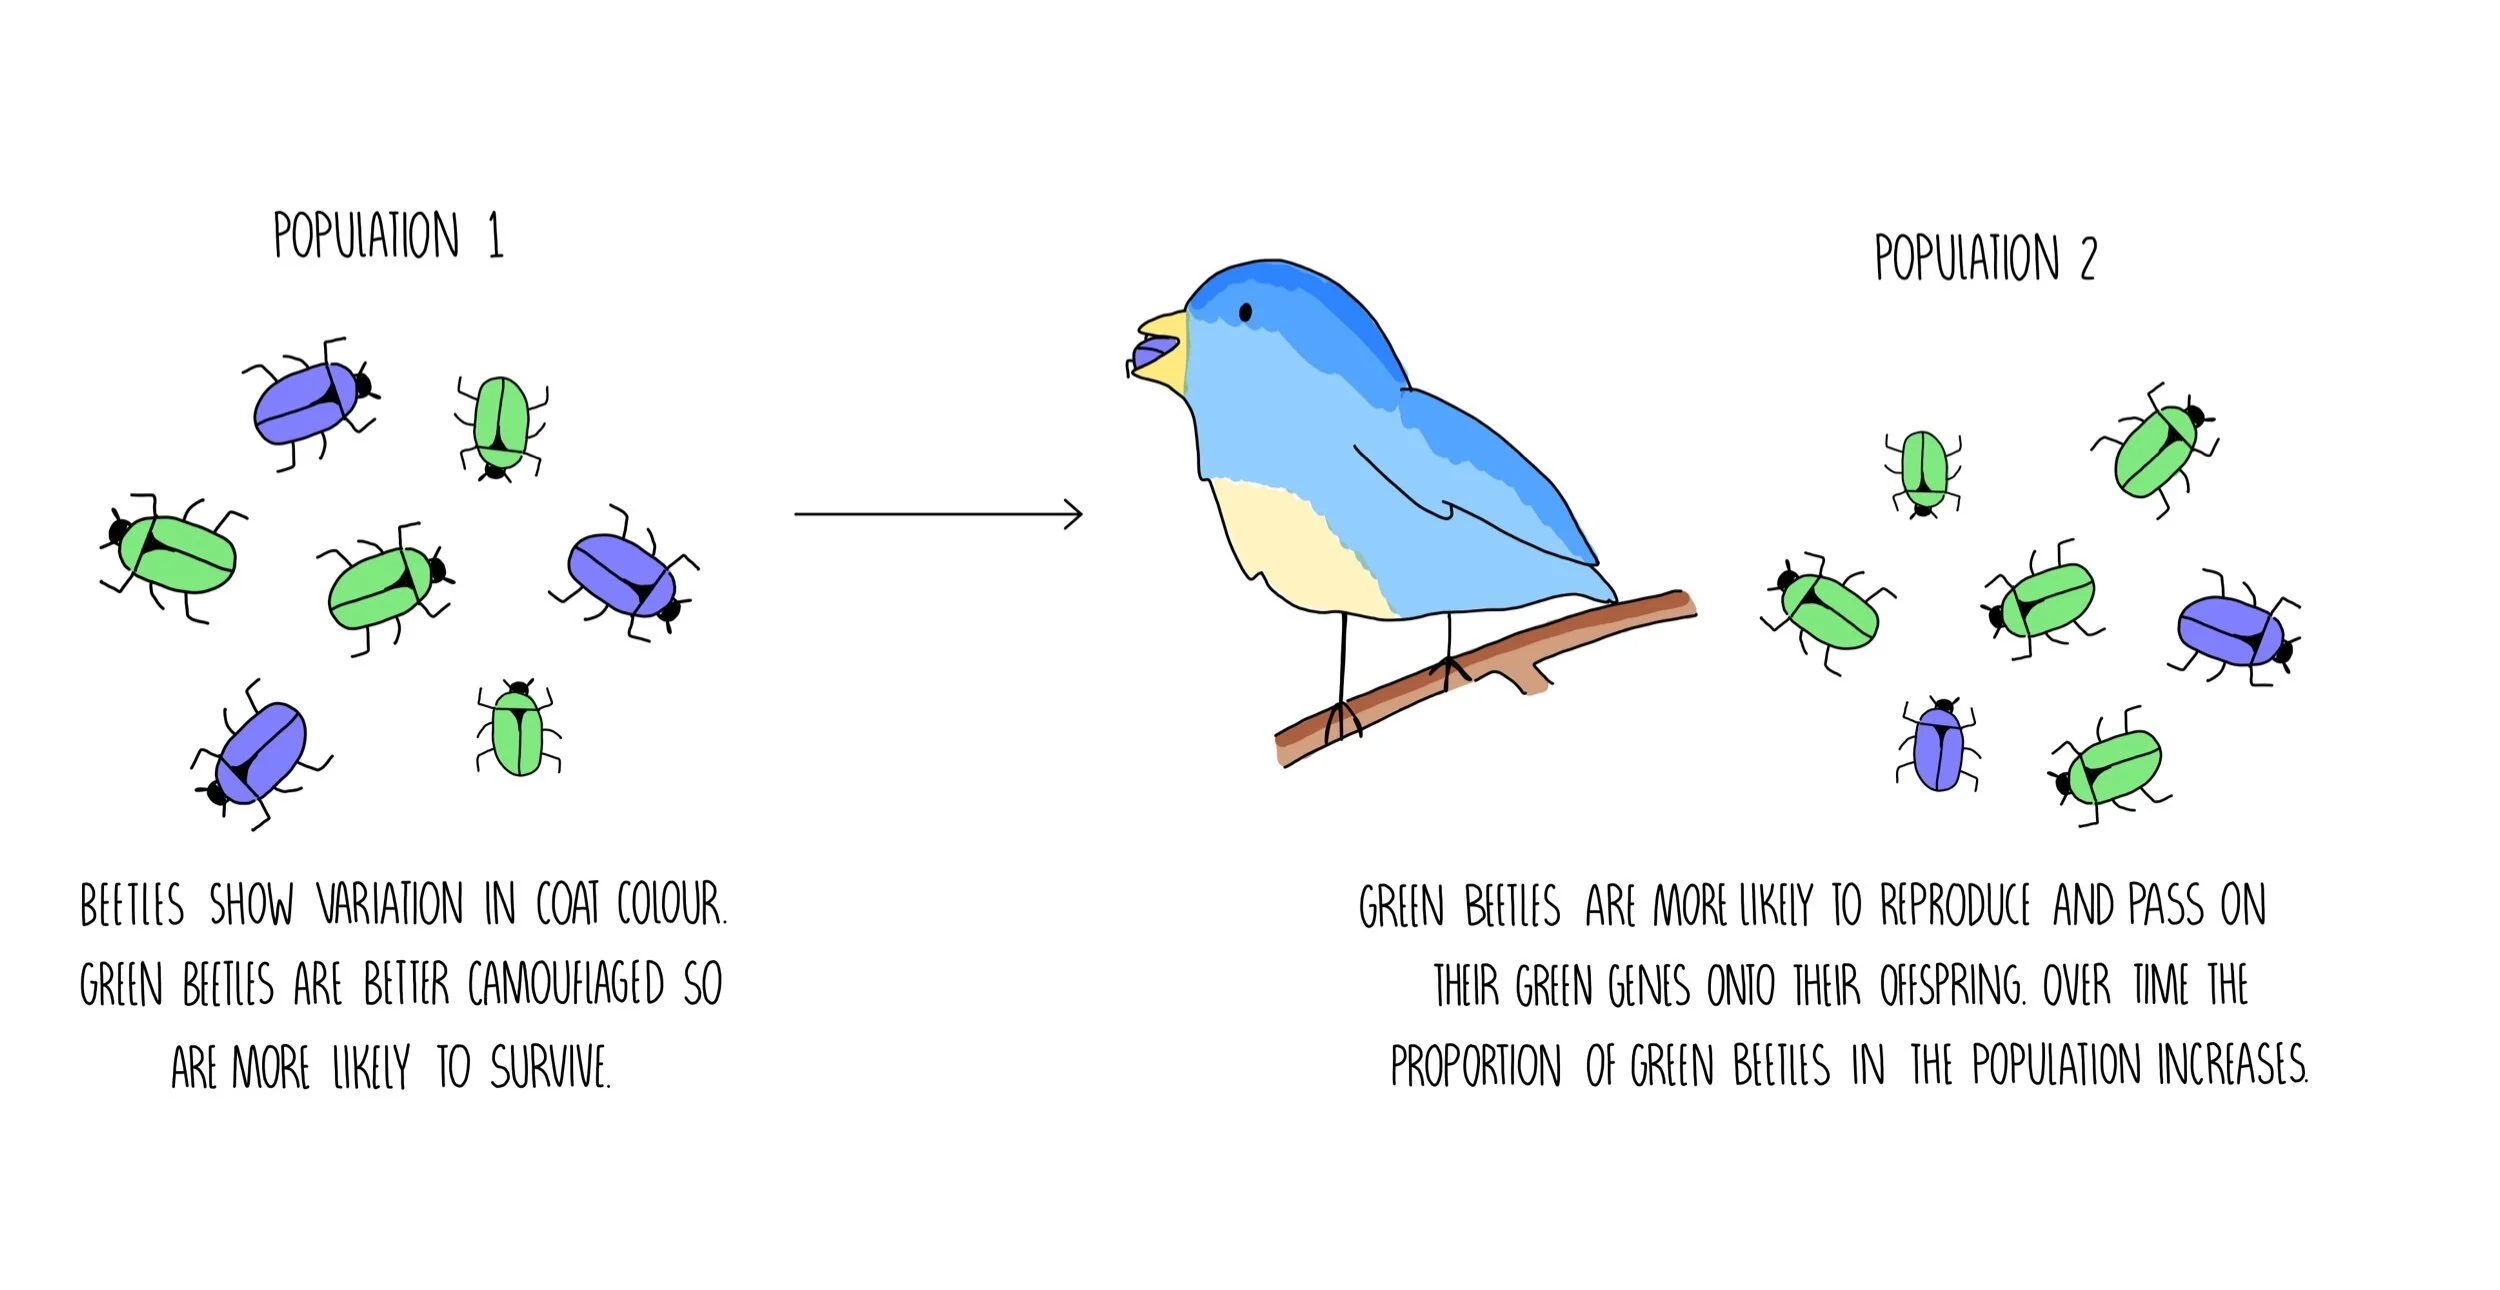
Natural selection is the process by which species evolve. Evolution is the change in allele frequency within a population over time. It can be broken down in the following steps:
There is variation within the population (because different individuals have different alleles). Gene mutations cause new alleles to appear in the population - some of these may be harmful but some may be beneficial.
Organisms with alleles which give them characteristics most suited to their environment are more likely to survive to reproductive age and pass on their genes to their offspring, compared to individuals which do not have the beneficial allele.
A greater proportion of individuals in the next generation have inherited the advantageous allele. These organisms are also more likely to survive and reproduce. They will also pass on the advantageous allele to their offspring.
Over time, the frequency of the advantageous allele increases in the population - this is evolution.
Evidence for evolution
Darwin’s theory of evolution by natural selection is supported by various types of evidence:
Fossils – arranging fossils in chronological order shows gradual changes in species over time.
DNA evidence – organisms that diverged (evolved to become different species) more recently have more similar DNA, as less time has passed for mutations to occur.
Molecular evidence - other molecules, such as amino acid sequences and antibody structure can also be compared for similarities between species. More closely related organisms have share more similarities in their molecules.
Evolution of pesticide resistance
Organisms (e.g. insects) evolve resistance to pesticides by natural selection:
A mutation gives rise to an allele which enables an insect to survive in the presence of pesticides. This increases intraspecific variation.
When pesticides are applied, most of the non-resistant insects die while the resistant insect survives. It now has less competition for food and other resources.
The pesticide-resistant insect reproduces and passes on its resistant allele to its offspring.
A new population of pesticide-resistant insects is produced.
Pesticide resistance is a serious problem:
Resistant pests that feed on crops are difficult to control and can lead to a significant loss of yield.
It could lead to the spread of disease if disease-carrying insects (e.g. mosquitos) develop pesticide resistance.
May require the development of new pesticides which costs time and money.