Genetics
Alleles
Genes exist in alternative forms called alleles which give rise to differences in inherited characteristics. For example, the gene for eye colour exists in three variations (alleles) which code for blue eyes, green eyes and brown eyes. We possess two alleles for each gene, one on each chromosome.
The combination of alleles which we possess is called our genotype and the visible characteristics that these alleles produce is called our phenotype. For example, plants with the genotype Tt will have a tall phenotype and plants with genotype tt will have a short phenotype.
Just as a person with a dominant personality always seems to have the final word, a dominant allele ‘decides’ what characteristic will be expressed from the gene. The dominant allele is always expressed, even if you only have one copy. A recessive allele can be thought of as the ‘weaker’ allele and can also determine the expressed characteristic if the bossy dominant allele isn’t around. Recessive alleles require both copies to be present in order to be expressed. In the following example, B represents the dominant allele for brown eyes whereas b represents the recessive allele for blue eyes.
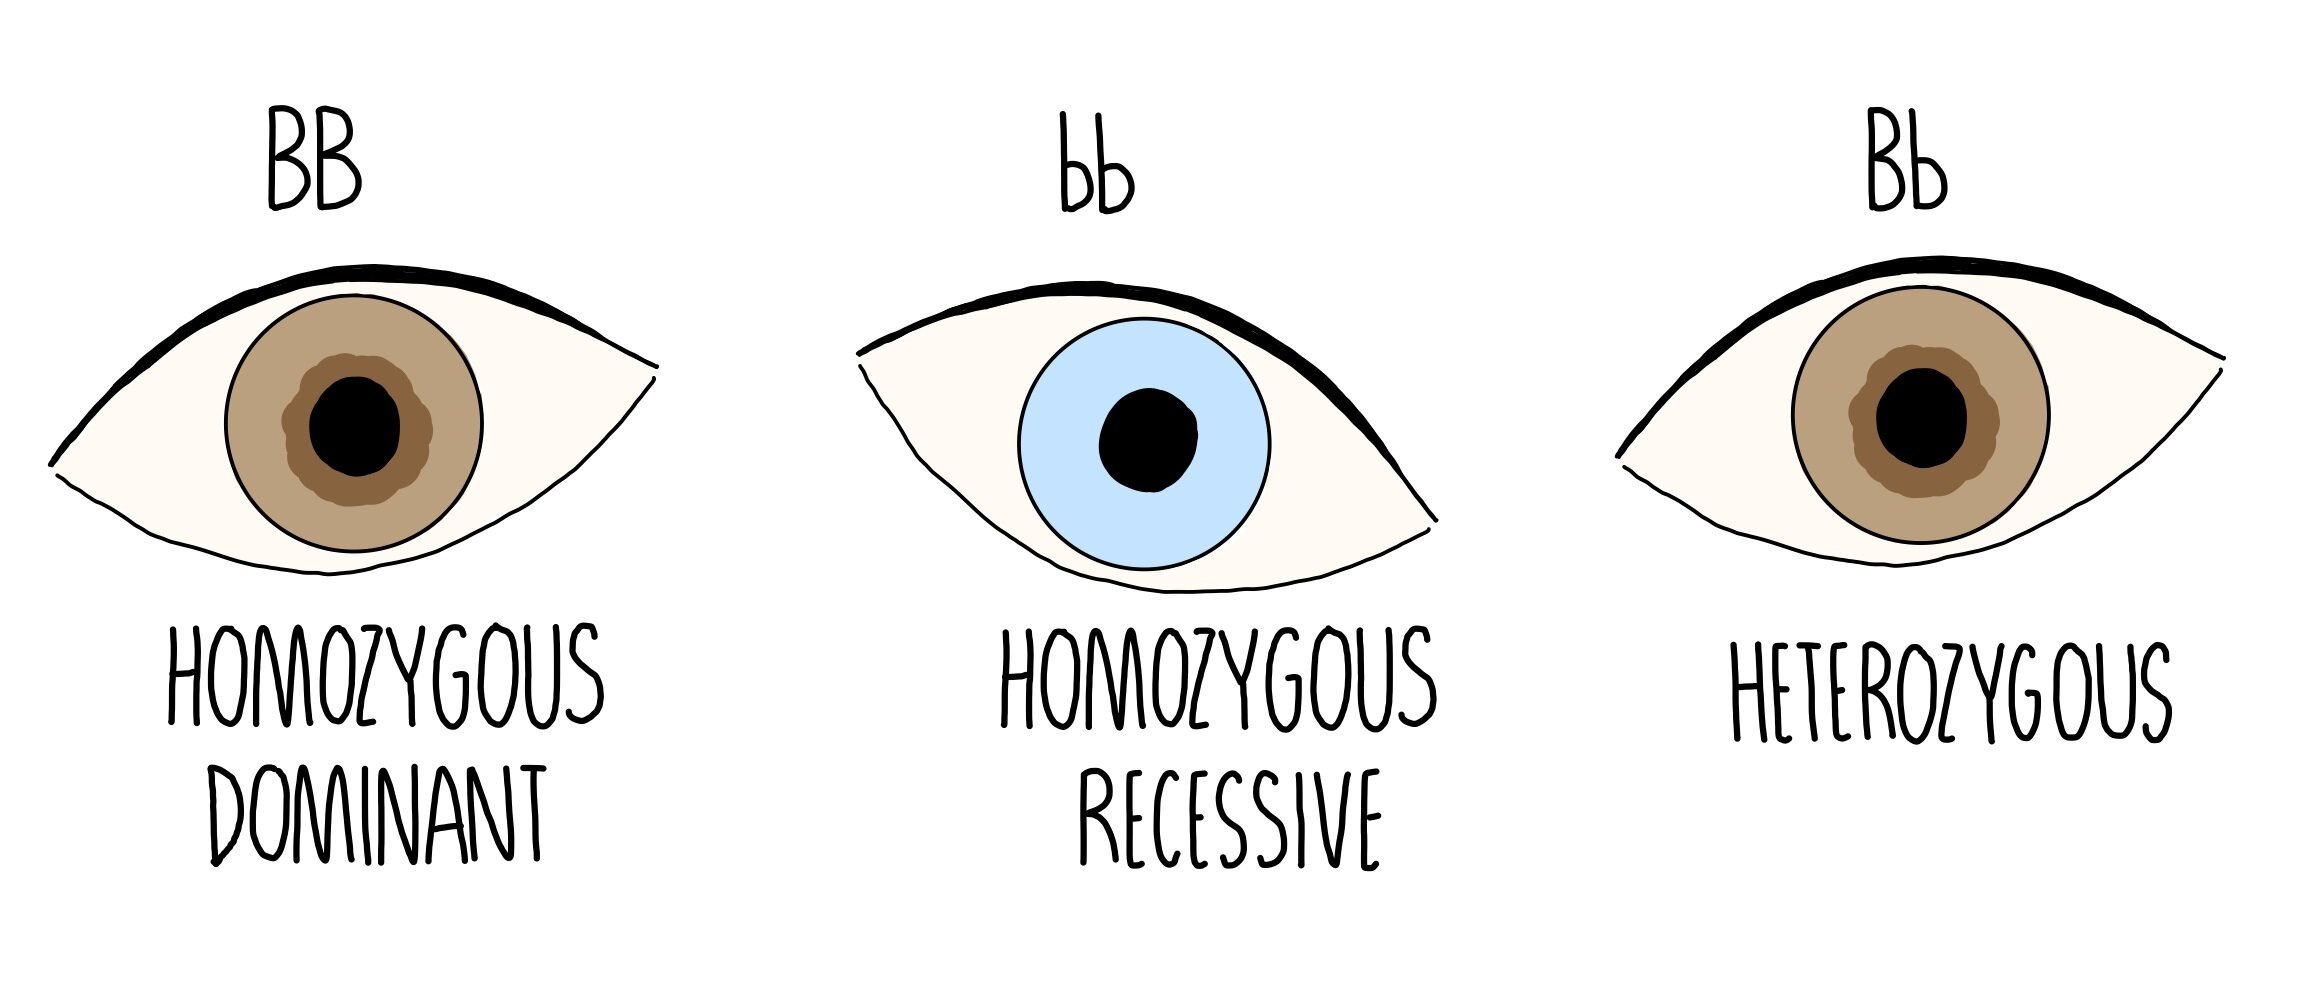
BB (homozygous dominant) gives the brown eye phenotype
Bb (heterozygous) gives the brown eye phenotype
bb (homozygous recessive) gives the blue eye phenotype
Sometimes alleles can be codominant which are more harmonious, with both alleles contributing to the phenotype. An example is the tortoiseshell coat colour in some cats, resulting from a combination of B (codes for orange fur) and b (which codes for black fur). Inheriting both alleles results in a patchwork of black and orange, referred to as tortoiseshell. Another example is the AB blood group, where both A and B antigens are expressed on blood cells.
Genetic diagrams
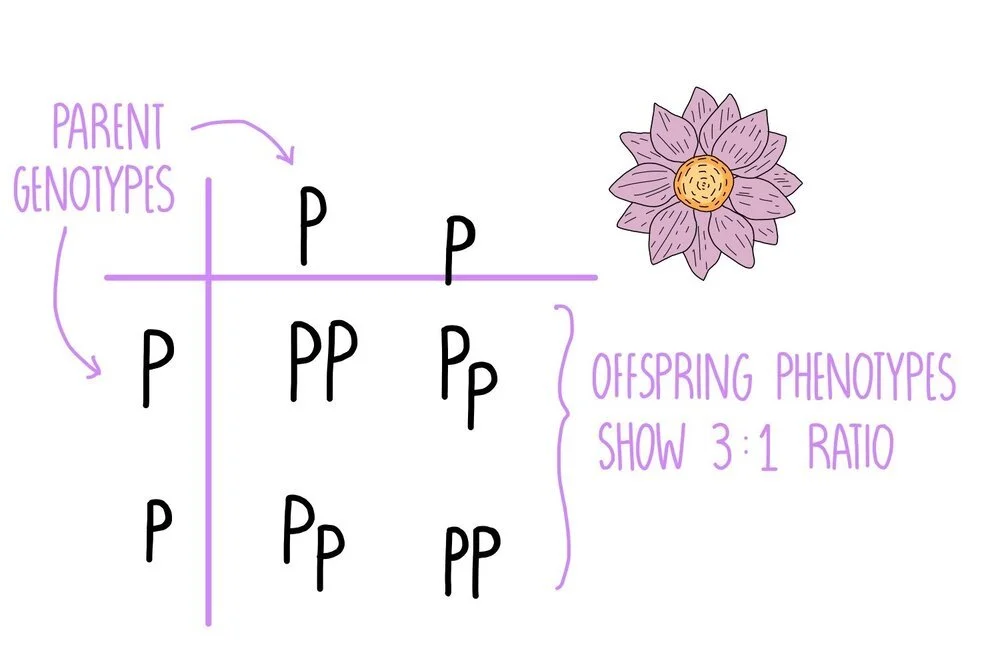
Monohybrid inheritance is the inheritance of characteristics controlled by a single gene. We can predict the characteristic in the offspring for this type of inheritance using Punnett squares. The parent gametes are written on the side, with the genotypes of possible offspring in the centre.
If the dominant P allele produces purple flowers and the recessive p allele produces white flowers, then we can see that breeding two heterozygous individuals will produce offspring with a 3:1 ratio of purple flowers to white flowers. This 3:1 ratio between the dominant phenotype and the recessive phenotype will always be seen in the offspring of two heterozygotes.

Multiple alleles
For some traits, there are more than two alleles for the same gene. For example, there are three different alleles for blood type (IA, IB and IO), but one person will only ever have two of them (one on each homologous chromosome). Allele O is recessive so anyone with blood type O must have two copies (homozygous) for this allele. Alleles A and B are codominant, so anyone with both of these alleles (heterozygous) will have the blood type AB.
Dihybrid crosses
You may be asked to produce a more complicated genetic cross, where you look at how two separate phenotypes are inherited. This looks tricky, but it’s actually pretty easy.
Let’s say we’re breeding mice in the lab and we’re interested in the inheritance of both eye colour and coat colour. Let’s say red eyes (R) are dominant over white eyes (r) and black fur (B) is dominant over brown fur (b) and we breed two parent mice who are both heterozygous for both traits (e.g. RrBb).
We draw the Punnett square just as we would for a monohybrid cross, except we need to write the two alleles (for the two different traits) in every possible combination they could appear in the gamete (RB, Rb, rB and rb). We write these in for each parent then combine them together to figure out the offspring genotypes. For two double heterozygotes, you should expect a 9:3:3:1 ratio in the offspring phenotypes. If you get a different phenotype ratio, then either the parents aren’t heterozygous or the alleles may be linked (see below).

Linked genes
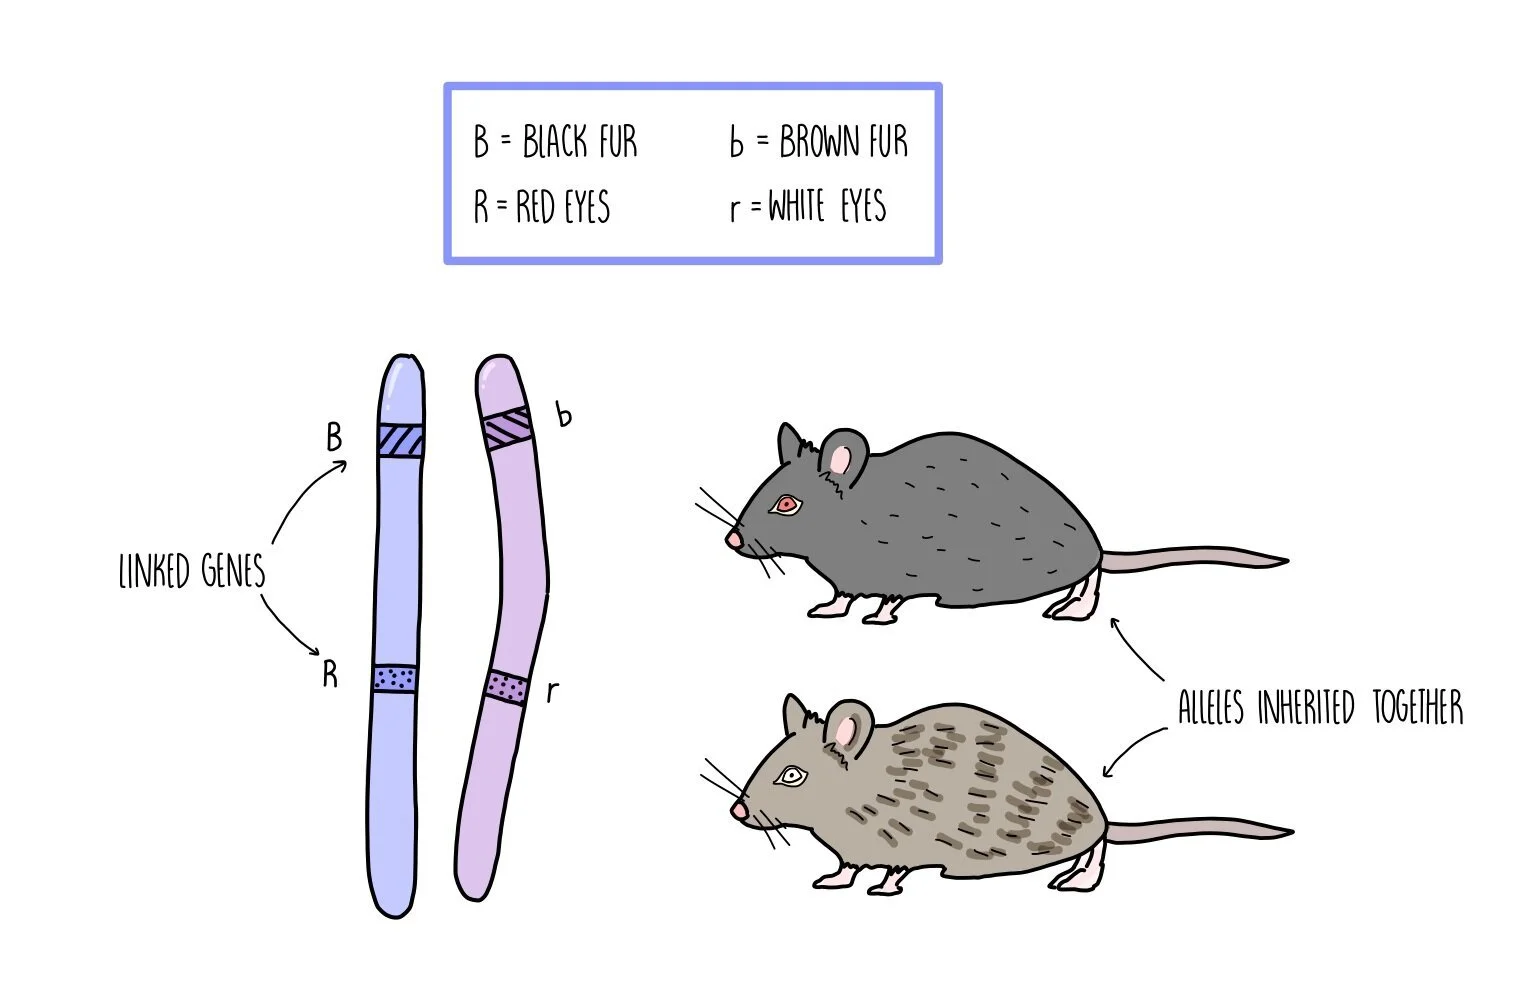
The position of a gene on a chromosome is called its locus. If the loci of two different genes are on the same chromosome, they are likely to be inherited together and are said to be linked. The only way that the genes will not be inherited together is if crossing over separates them during meiosis (the chiasmata would have to form between the two genes). The closer the loci of the two genes, the less likely this is to happen and the higher the probability that the genes will be inherited together. This means that any offspring will probably express both phenotypes together than either phenotype separately.
The image below shows an example of gene linkage in rats. If the genes for coat colour and eye colour are located on the same chromosome, they will be inherited together and the offspring will show both phenotypes together. For example, there will be rats with both black fur and red eyes, and with both brown fur and white eyes but not many with black fur + white eyes (or likewise, brown fur + red eyes). To get these combinations of phenotypes, crossing over must have occurred between the homologous chromosomes to cause the alleles to end up on the same chromosome and be inherited together.
Sex Linkage
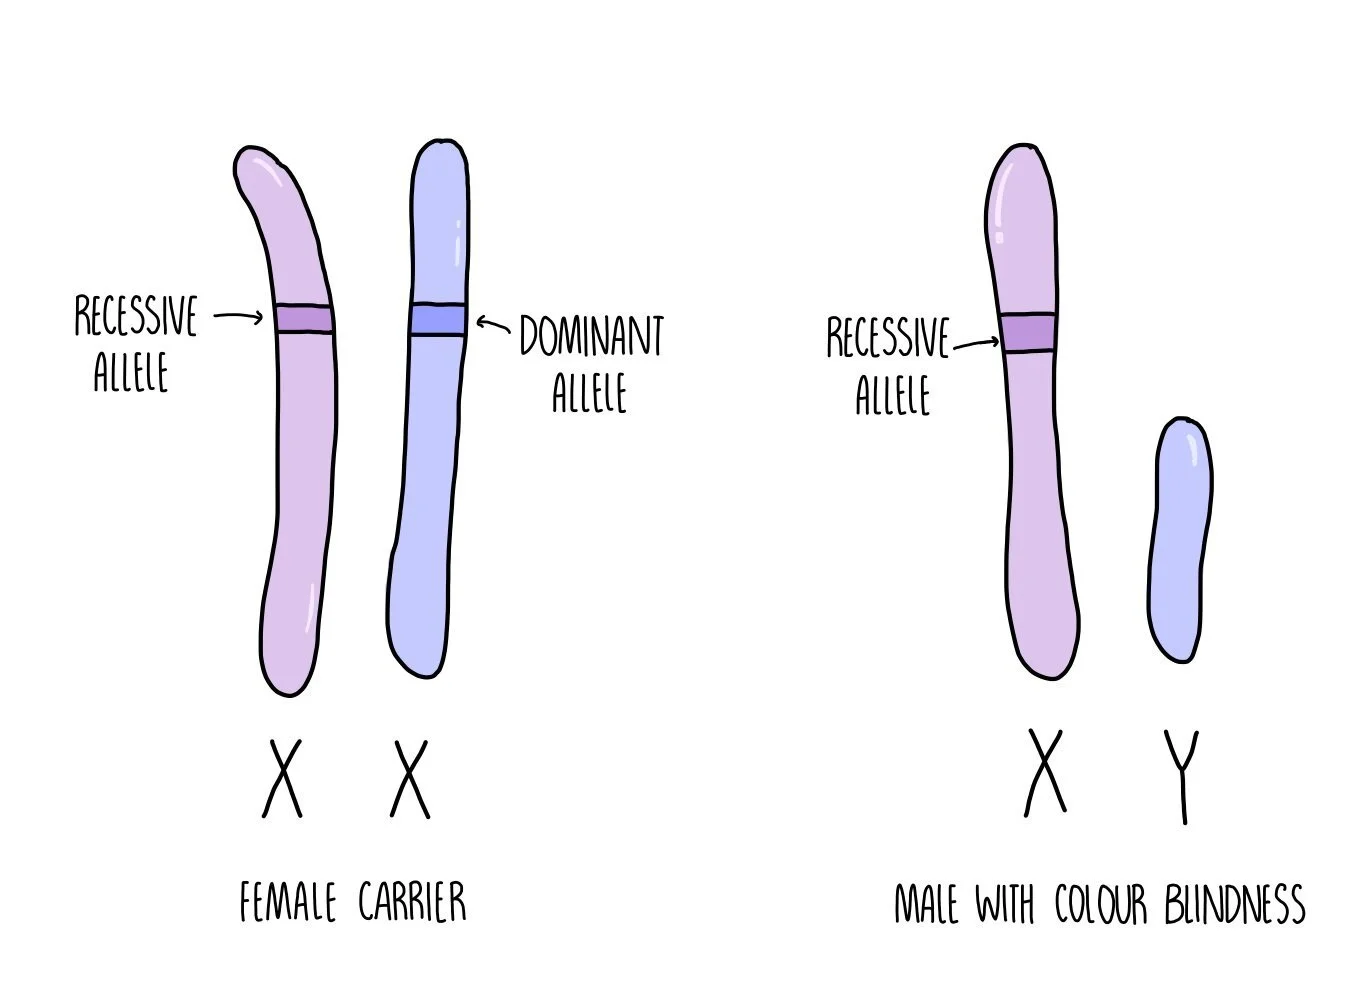
Genes which are located on one of the sex chromosomes (X or Y) are said to be sex-linked and their expression will depend on whether the offspring is male (XY) or female (XX). The Y chromosome is much smaller than the X chromosome, so most alleles are carried on the X chromosome (they are X-linked). Men only have one X chromosome which means that they will only inherit one allele for these genes, compared to women who will inherit two. This means that if men inherit a recessive allele (which causes disease) for a gene found on the X-chromosome, they will have the disease. Women who inherit the recessive allele will just be a carrier, since they have another X chromosome with the dominant, functioning allele. For women to have X-linked diseases, they must inherit two disease alleles (they will have a homozygous recessive phenotype). Examples of sex linked disorders include haemophilia and red-green colour blindness.
Epistasis
Epistasis is when the allele of one gene masks the expression of the alleles of other genes. For example, in plants the allele P may control petal colour with the purple (P) allele dominant over the allele for white (p) petals. But expression of the purple pigment may require the plant to also possess an allele that codes for an enzyme that synthesises the pigment. The allele for the active enzyme (E) could be dominant over the allele for the inactive enzyme (e). This means that even if a plant contains the purple allele (so either Pp or PP), it won’t be expressed unless they are also homozygous or homozygous dominant for the active enzyme allele (Ee or EE). Crosses involving epistatic genes don’t result in the phenotypic ratios that you’d expect for normal monohybrid and dihybrid crosses.
Chi Squared Test
The chi squared test is a statistical test that is used to see if the results gathered during an experiment (the observed results) are what we expected to find (the expected results). We first have to state the null hypothesis - the null hypothesis is always that there is no significant difference between the observed and expected results. The chi squared test will allow us to either accept or reject the null hypothesis.
Look at the example described below to see how you would do this:
Let’s say you’re carrying out an experiment to determine the genotypes of two organisms for a particular trait. A gene which determines flower colour is controlled by 2 alleles - the dominant allele (P) gives rise to purple flowers and the recessive allele (p) produces white flowers. If two heterozygous purple flowers are crossed, we would expect to see a 3:1 ratio of purple flowers to white flowers in the offspring - these are our expected results.
Now we’ll cross-breed the two plants and determine the number of offspring showing each phenotype. An example is shown in the table below.
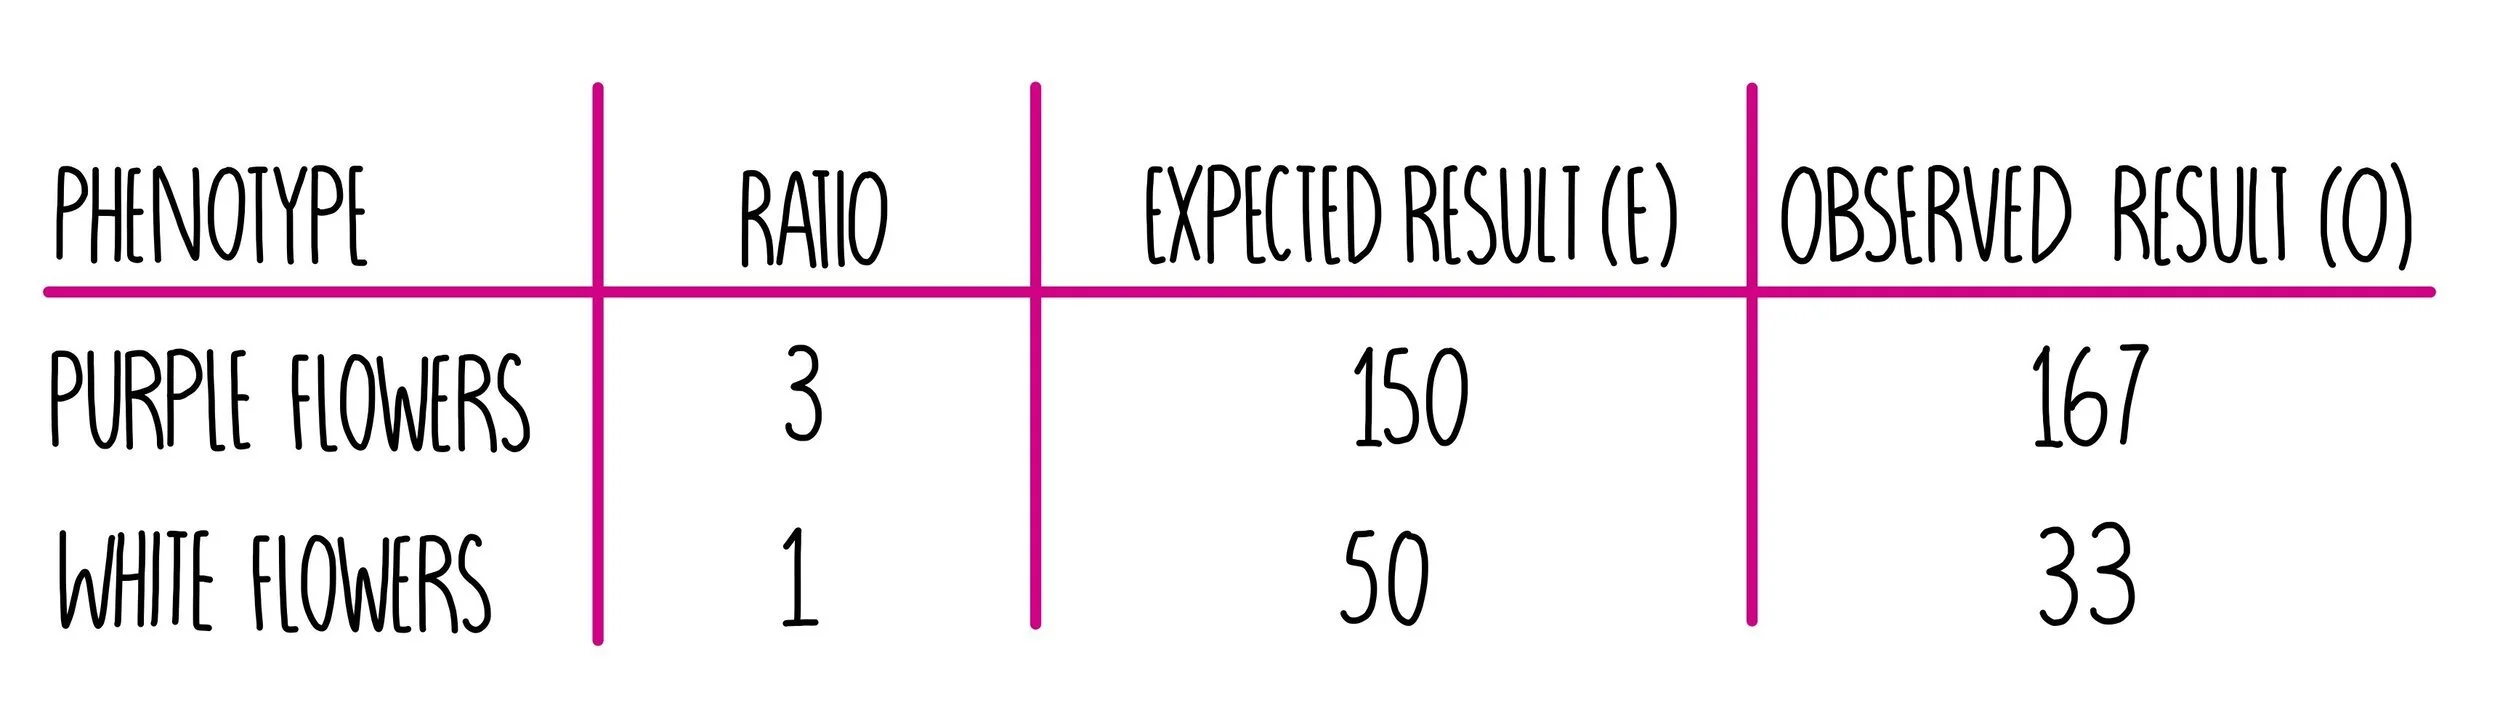
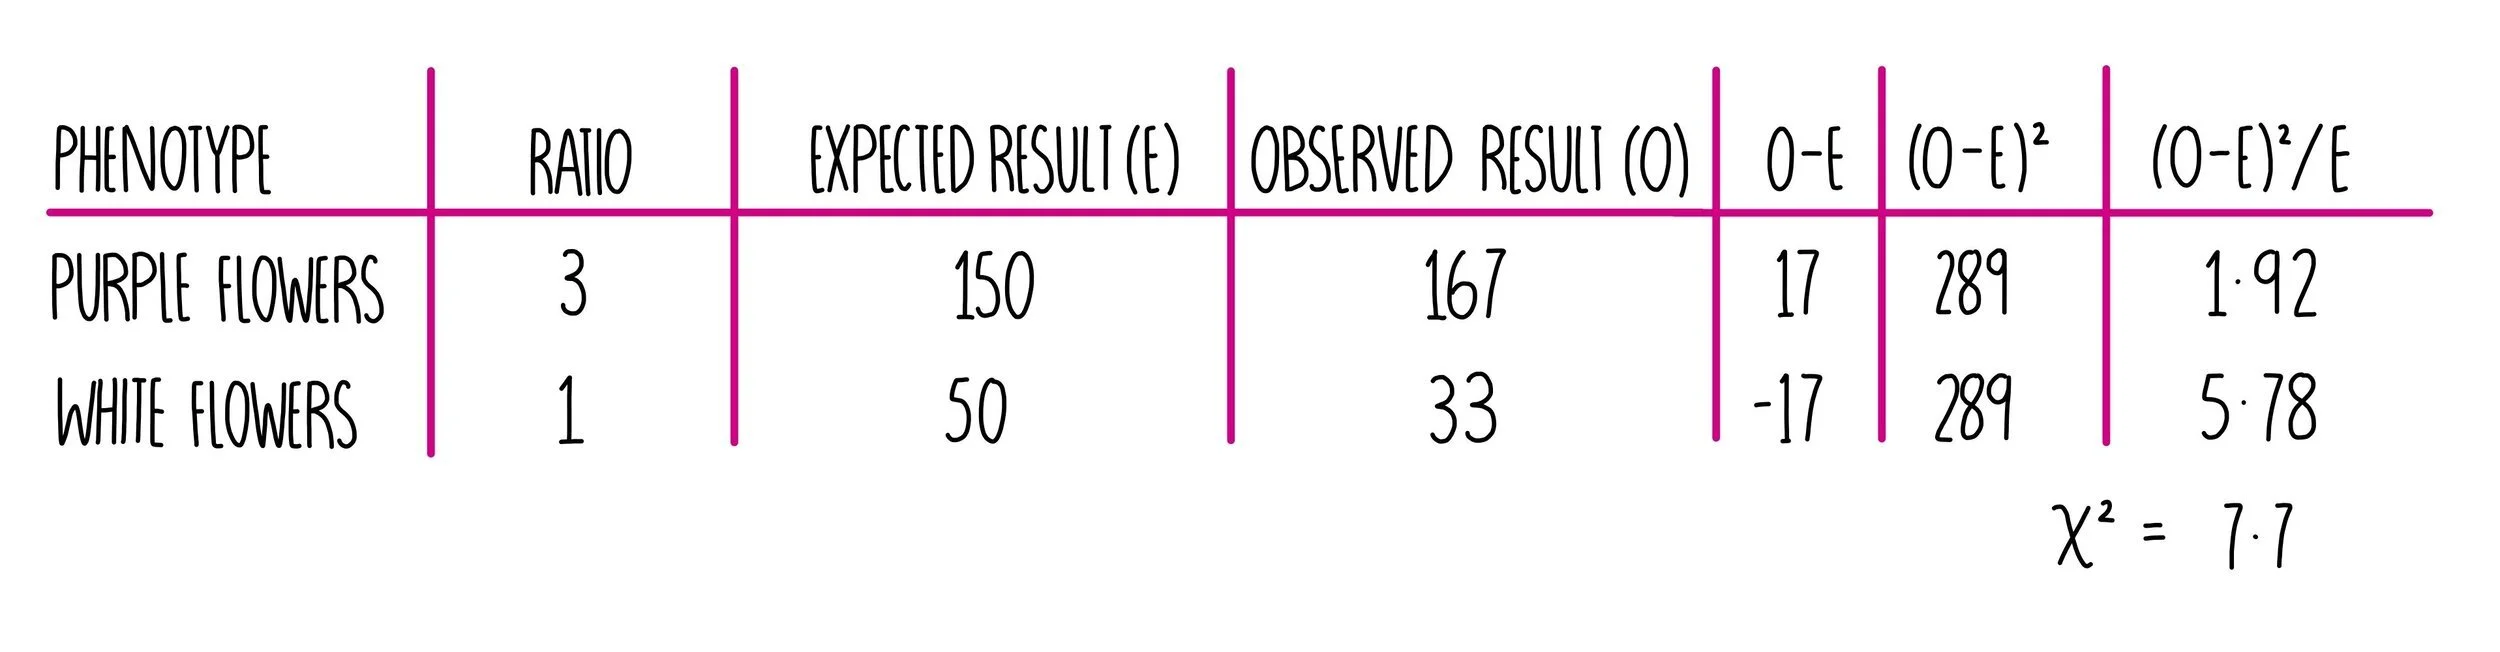
Then we use these results to calculate a value for chi squared. We do this by calculating the difference between the observed and expected result (O - E). We then square that number (O - E2) and divide that value by the expected result ((O - E2)/E). The values obtained for both phenotype need to be added together to get our chi squared value.
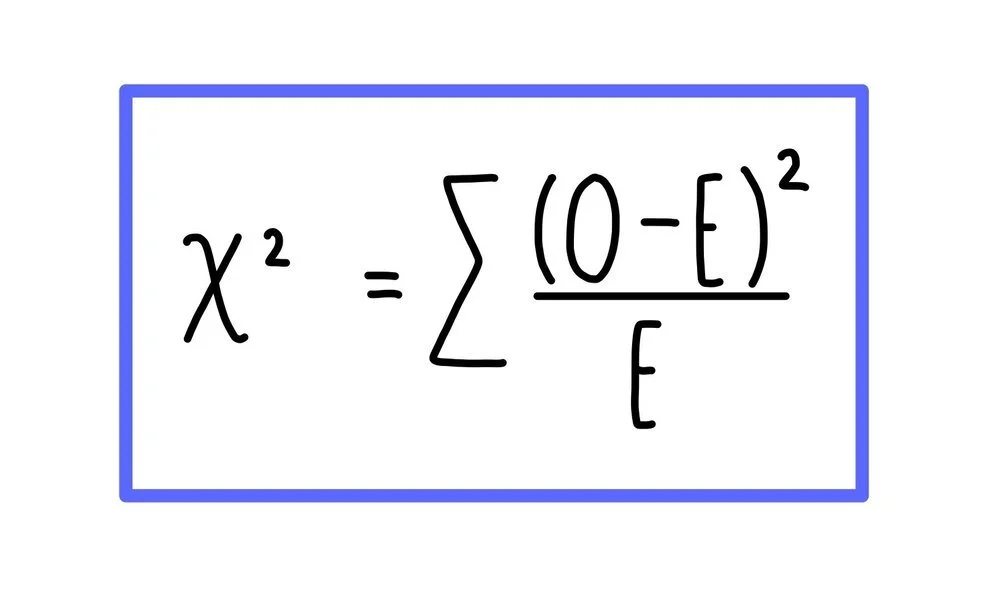
This can be summarised using the formula below. You don’t need to memorise this formula - you’ll be given it in the exam.
The last thing you need to do is to compare your chi squared value to the critical value. The critical value is the value of chi squared that corresponds to a 0.05 (5%) level of probability that the difference between our observed and expected results is due to chance. If your chi squared value is larger than or equal to the critical value then there is a significant difference between the observed and expected results. This means that something other than chance is causing the difference in the results and the null hypothesis can be rejected. However, if your chi squared value is smaller than the critical value that means there is no significant difference between the observed and expected results. This means any difference between the observed and expected results is the variation you’d expect due to chance and the null hypothesis can be accepted. In this case, this means that our theory that petal colour follows a monohybrid pattern of inheritance is supported.
You may have to work out the critical value for yourself from a table. The table will give you different critical values for different probability levels at different degrees of freedom. The degrees of freedom is equal to the number of groups in the experiment (in this case, the number of different phenotypes) minus one. We had two different phenotypes (purple and white) so our degrees of freedom = 1.
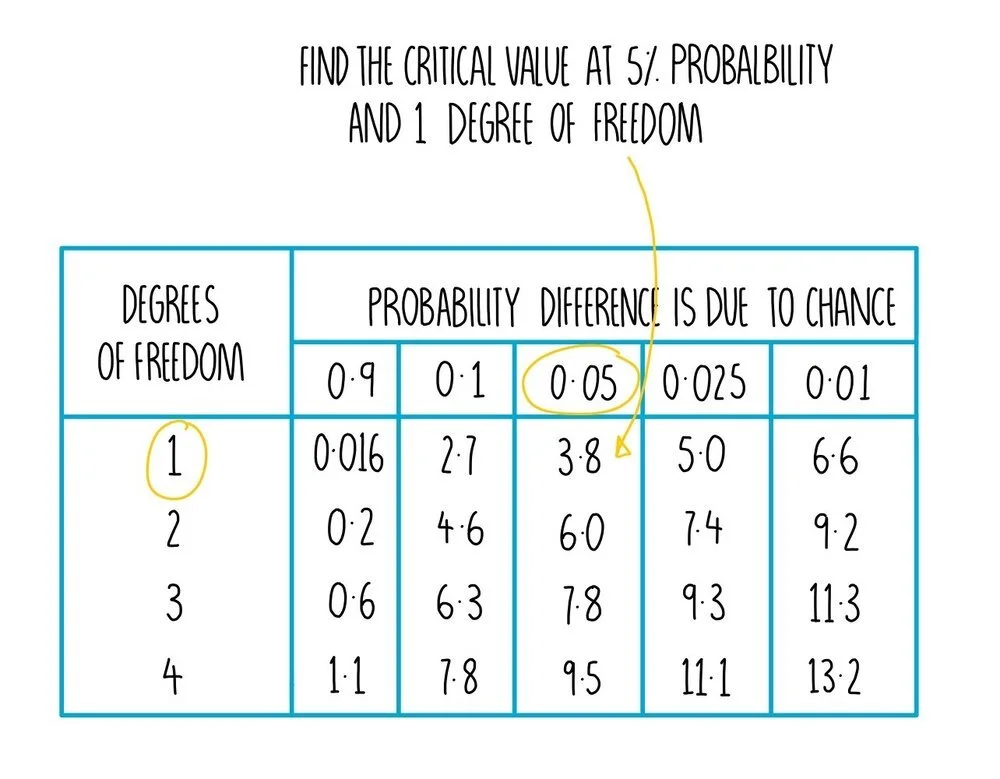
In our experiment, we obtained a chi squared value of 7.7. The critical value at 5% probability (0.05) and 1 degree of freedom is 3.8. Our chi squared value is larger than the critical value which means there is a significant difference between the observed and expected results. The difference is due to something other than chance so we need to reject the null hypothesis. Our results show that the plants we were breeding were not heterozygous or that petal colour in these plants does not follow a simple monohybrid pattern of inheritance.